Risk and Evidence Communication
These projects relate to the design and evaluation of tools to communicate information about:
- Risk
- Uncertainty
- Conditional events (natural frequencies)
- Risk assessment results (Risk Profiles)
Tools to improve comprehension of risks
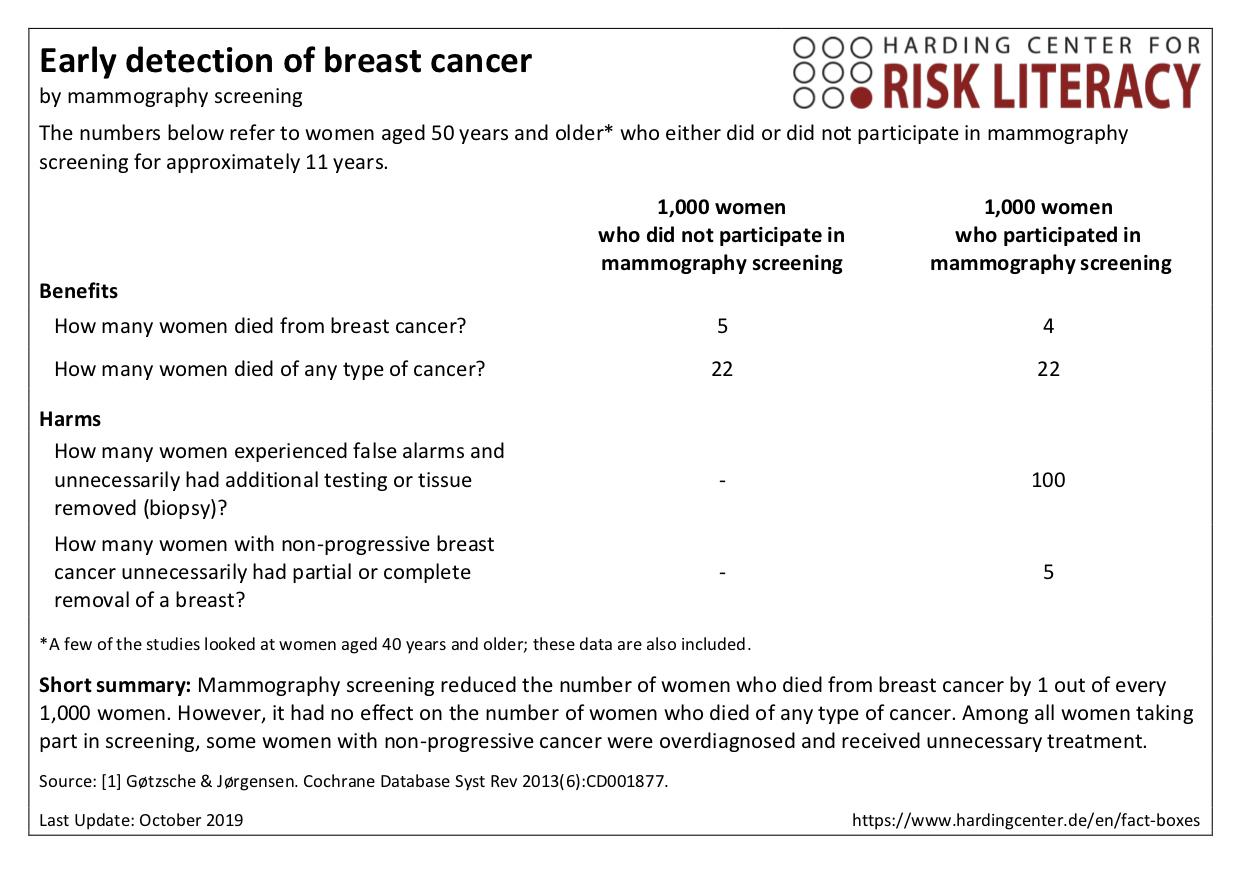
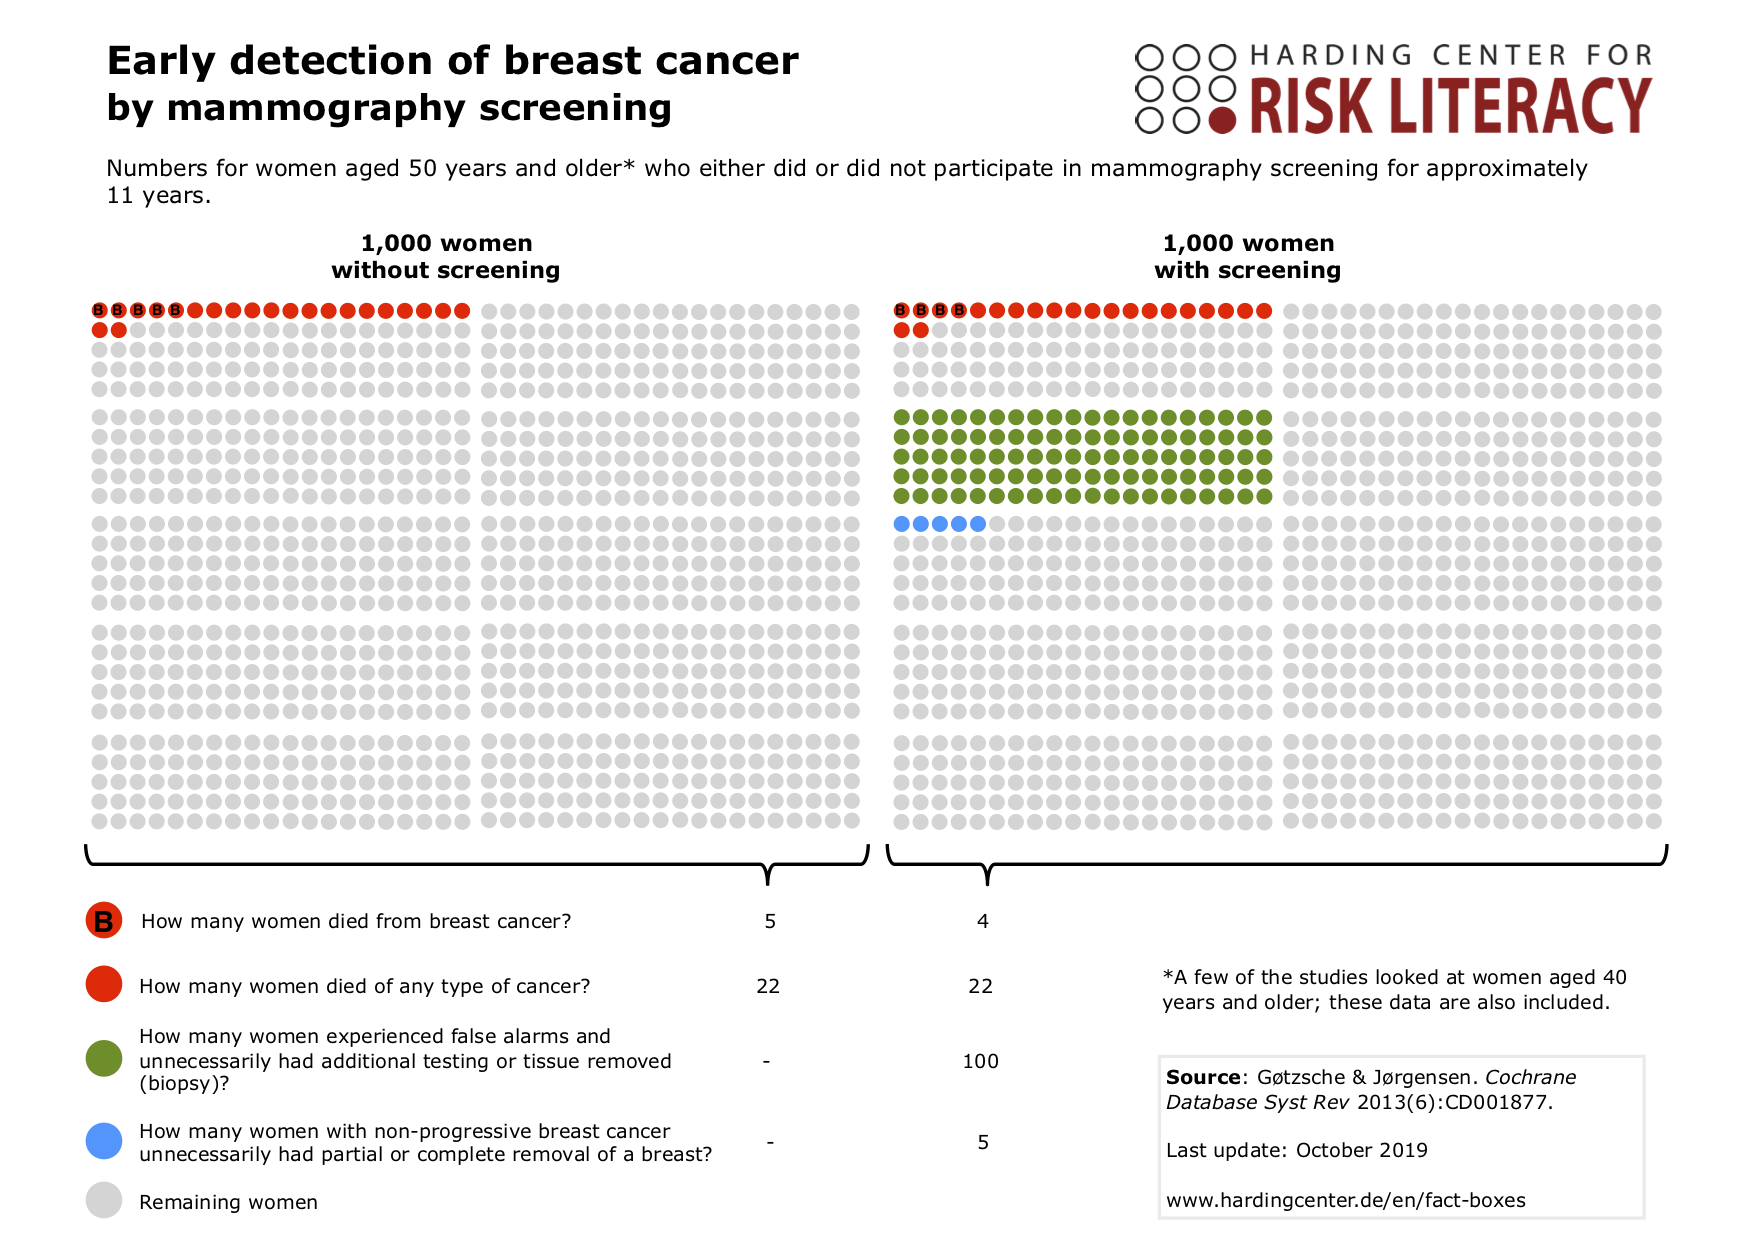
We have evaluated how well Fact Boxes and Icon Arrays improve people's comprehension of the benefits and harms of medical procedures or treatments.
Fact Boxes present a summary of the best available evidence about the benefits and harms of medical procedures, treatments, or health behaviours in a simple table:
Evidence can also be visualised in Icon Arrays:
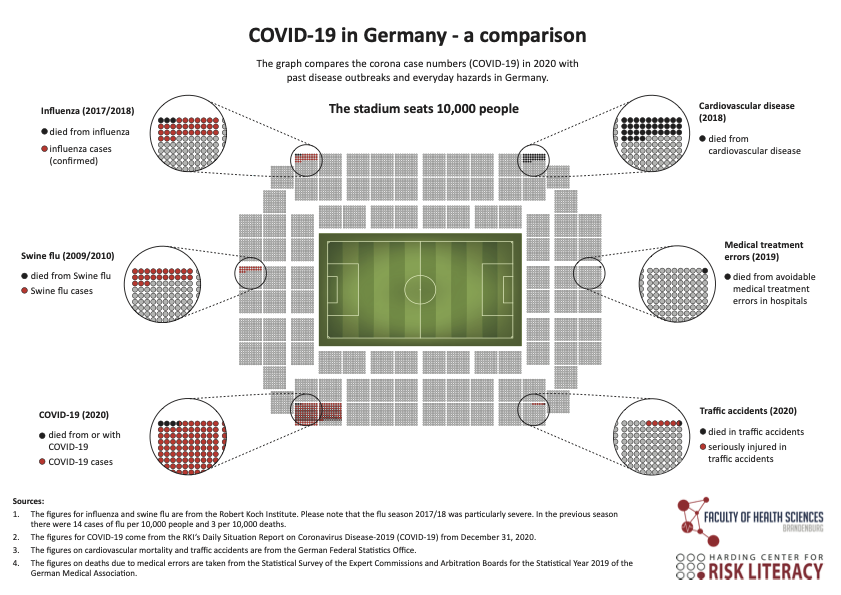
During the COVID-19 pandemic, I designed an Icon Array graphic representing a football stadium to help make comparisons between COVID-19 and other disease outbreaks and everyday risks. A high-quality original can be found here .
Related Publications
Brick, C., , & Freeman, A. L. (2020). Risk communication in tables vs. text: a Registered Report randomised trial on ’fact boxes’. Royal Society Open Science, 7:190876. doi:10.1098/rsos.190876
 @article{brick2020,
  title = {Risk Communication in Tables versus Text: A Registered Report Randomized Trial on ‘fact Boxes'},
  author = {Brick, Cameron and McDowell, Michelle and Freeman, Alexandra L. J.},
  date = {2020},
  journaltitle = {Royal Society Open Science},
  shortjournal = {R. Soc. open sci.},
  volume = {7},
  pages = {190876},
  doi = {10.1098/rsos.190876},
  number = {3}
}
, Gigerenzer, G, Wegwarth, O, & Rebitschek, F (2019). Effect of tabular and icon fact box formats on comprehension of benefits and harms of prostate cancer screening: A randomized trial. Medical Decision Making, 39(1), 41-56. doi:10.1177/0272989X18818166
 @article{mcdowell2019,
  title = {Effect of Tabular and Icon Fact Box Formats on Comprehension of Benefits and Harms of Prostate Cancer Screening: A Randomized Trial},
  author = {McDowell, Michelle and Gigerenzer, Gerd and Wegwarth, Odette and Rebitschek, Felix G.},
  date = {2019},
  journaltitle = {Medical Decision Making},
  volume = {39},
  pages = {41--56},
  doi = {10.1177/0272989X18818166},
  number = {1}
}
, Rebitschek, F, Gigerenzer, G, & Wegwarth, O (2016). A simple tool for communicating the benefits and harms of health interventions: A guide for creating a fact box. MDM Policy & Practice (1), 1-10. doi:10.1177/2381468316665365
 @article{mcdowell2016a,
  title = {A Simple Tool for Communicating the Benefits and Harms of Health Interventions: A Guide for Creating a Fact Box},
  author = {McDowell, Michelle and Rebitschek, Felix G. and Gigerenzer, Gerd and Wegwarth, Odette},
  date = {2016-07-01},
  journaltitle = {MDM Policy \& Practice},
  volume = {1},
  pages = {2381468316665365},
  doi = {10.1177/2381468316665365},
  number = {1}
}
Formats for conveying uncertainty
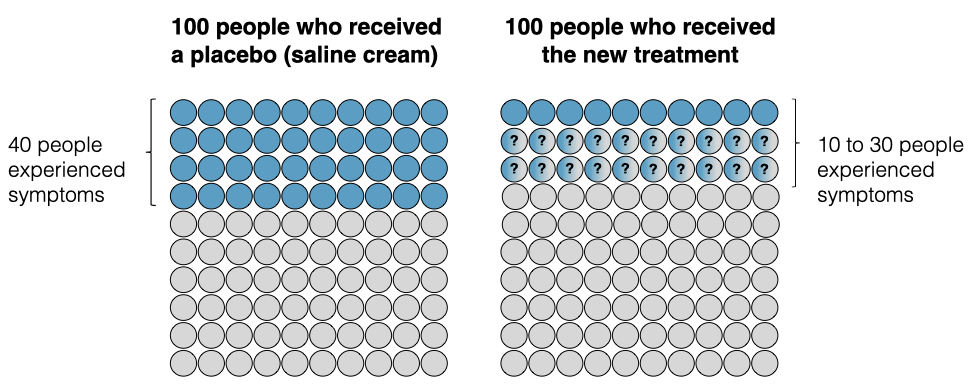
Our results suggest that it would not be detrimental to for risk communicators to communicate imprecision or conflicting estimates to the public. However, caution should be taken when communicating a lack of evidence, where people estimate treatment effects to be large in the absence of clear data. Further, tables, bar graphs, icon arrays that were adapted to incorporate uncertainty information were equally effective at communicating these different types of uncertainty.
Related Publications
& Kause, A. (2021). Communicating uncertainties about the effects of medical interventions using different display formats. Risk Analysis, 41 (12), 2220-2239. doi:10.1111/risa.13739
 @article{mcdowell2021,
  title = {Communicating Uncertainties About the Effects of Medical Interventions Using Different Display Formats},
  author = {McDowell, Michelle and Kause, Astrid},
  date = {2021},
  journaltitle = {Risk Analysis},
  volume = {41},
  pages = {2220-2239},
  doi = {10.1111/risa.13739},
  number = {12}
}
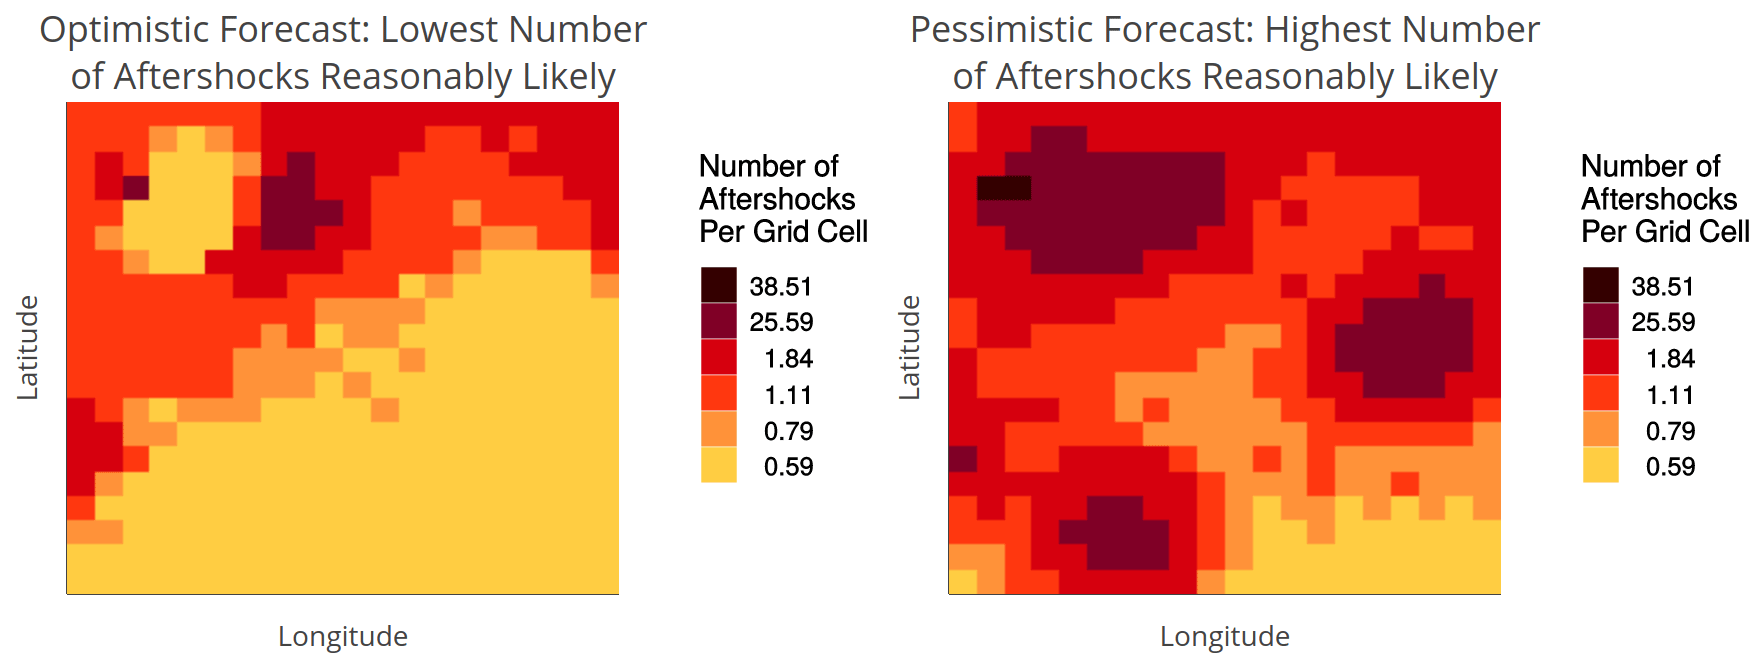
Conveying uncertainty using the bounds of a forecast interval in aftershock forecast maps resulted in poorer accuracy than other visualisation techniques when it comes to people being able to read off uncertainty values. However, only with the bounds map did users demonstrate an understanding that forecasts with high uncertainty could have outcomes worse than forecasted.
Related Publications
Schneider, M., Guttorp, P., Steel, A. E., & Fleischhut, N. (2022). Effective uncertainty visualization for aftershock forecast maps. PLOS ONE, 22(4). doi:10.5194/nhess-22-1499-2022
 @article{schneider2022,
  title = {Effective uncertainty visualization for aftershock forecast maps},
  author = {Schneider, Max and McDowell, Michelle and Guttorp, Peter and Steel, Ashley E and Fleischhut, Nadine},
  date = {2022},
  journaltitle = {Natural Hazards and Earth System Sciences},
  volume = {22},
  pages = {1499-1518},
  doi = {10.5194/nhess-22-1499-2022},
  number = {4}
}
Natural Frequencies for communicating conditional probabilities
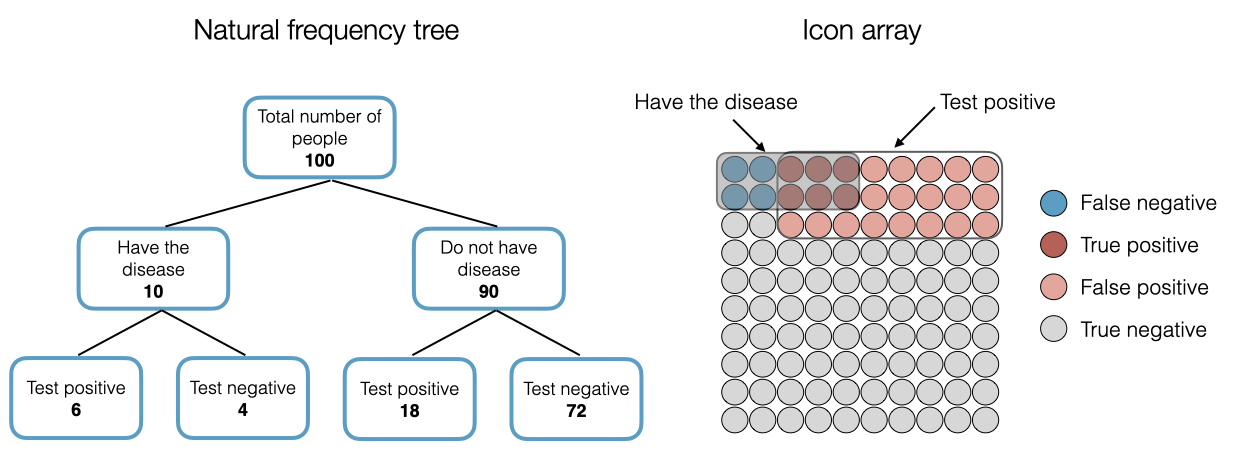
It is possible to improve people’s inferences based on probabilistic information if conditional probabilities are presented as natural frequencies. Visual aids can help boost performance even further.
Related Publications
, Galesic, M, & Gigerenzer, G (2018). Natural frequencies do foster public understanding of medical tests: Comment on Pighin, Gonzales, Savadori and Girotto (2016). Medical Decision Making. 38(3), 390-399. doi:10.1177/0272989X18754508
 @article{mcdowell2018,
  title = {Natural Frequencies Do Foster Public Understanding of Medical Tests: Comment on Pighin, Gonzalez, Savadori, and Girotto (2016)},
  author = {McDowell, Michelle and Galesic, Mirta and Gigerenzer, Gerd},
  date = {2018},
  journaltitle = {Medical Decision Making},
  shortjournal = {Med Decis Making},
  volume = {38},
  pages = {390--399},
  doi = {10.1177/0272989X18754508},
  number = {3}
}
& Jacobs, P (2017). Meta-analysis of the effect of natural frequencies on Bayesian reasoning. Psychological Bulletin, 143, 1273-1312. doi:10.1037/bul0000126
 @article{mcdowell2017,
  title = {Meta-Analysis of the Effect of Natural Frequencies on {{Bayesian}} Reasoning},
  author = {McDowell, M. and Jacobs, P.},
  date = {2017},
  journaltitle = {Psychological Bulletin},
  shortjournal = {Psychol. Bull.},
  volume = {143},
  pages = {1273--1312},
  doi = {10.1037/bul0000126}
}
VisRisk: Communicating results of risk assessments
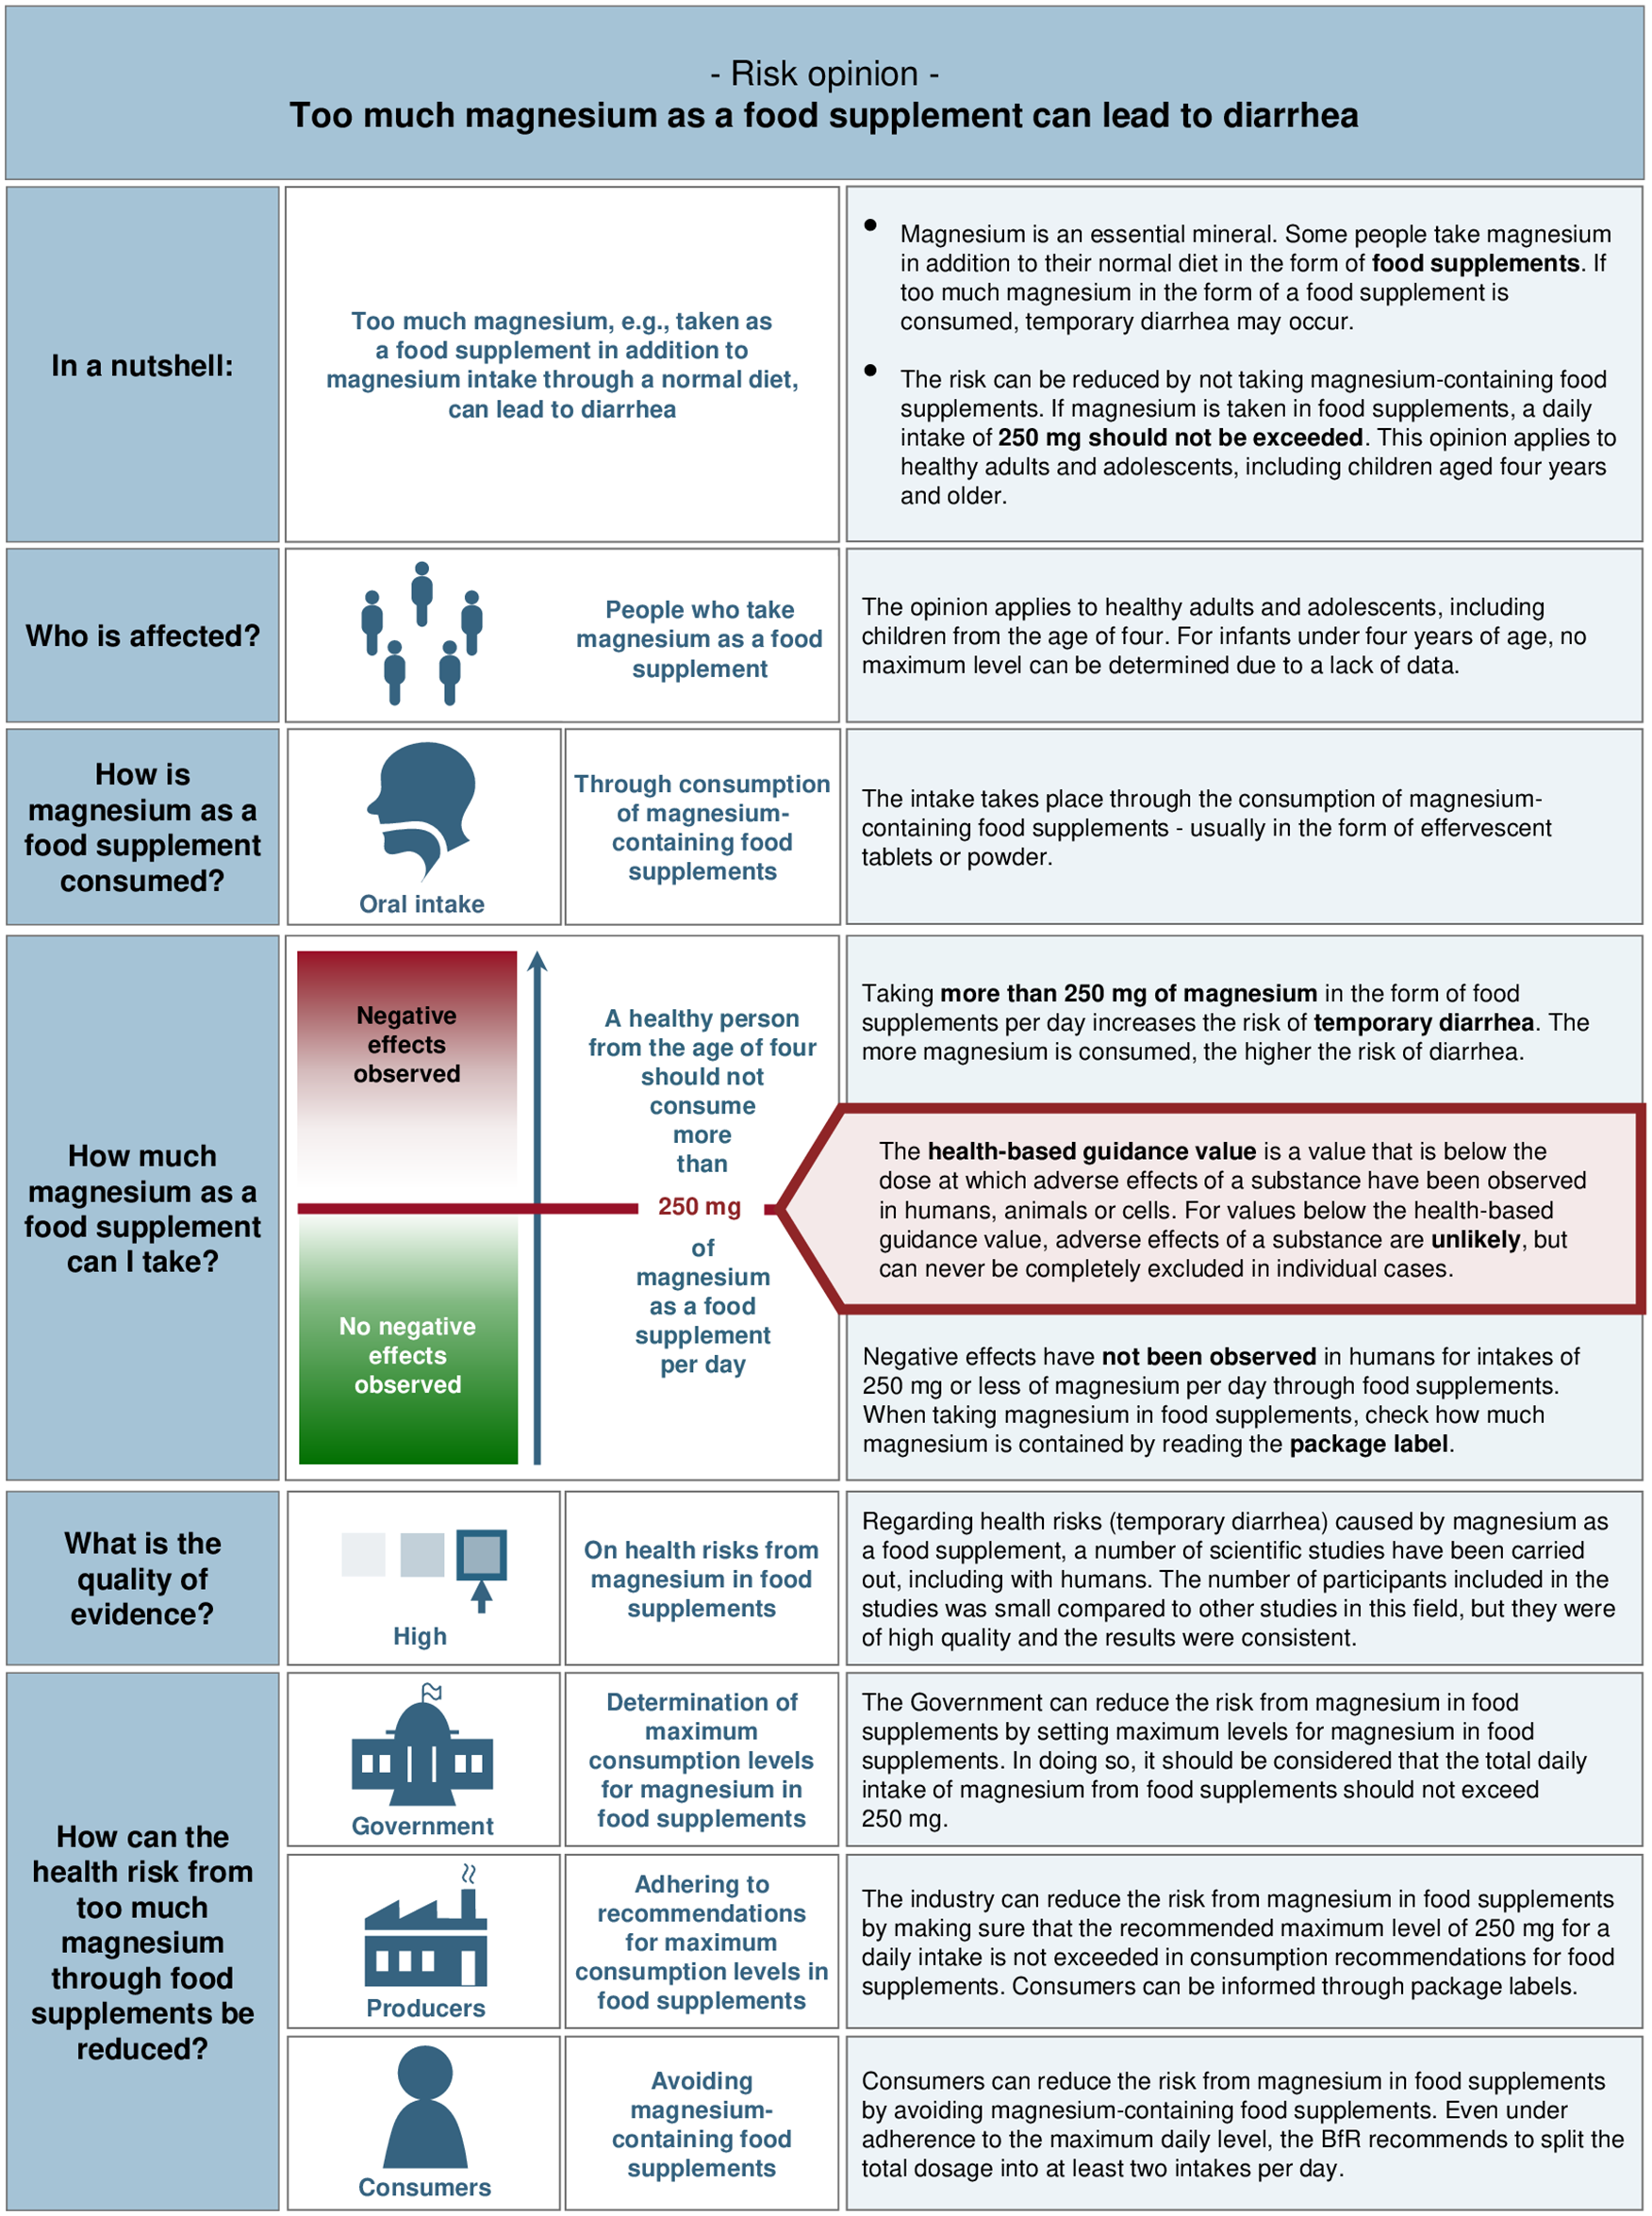
In collaboration with the German Federal Institute for Risk Assessment, we redesigned and evaluated a new "Risk Profile" to communicate results of risk assessments about food, feed, and consumer products.
Related Publications
Ellermann, C., Schirren, C. O., Lindemann, A.-K., Koch, S., Lohmann, M., & Jenny, M. A. (2022). Identifying content to improve risk assessment communications within the Risk Profile: Literature reviews and focus groups with expert and non-expert stakeholders. PLOS ONE, 17(4). doi:10.1371/journal.pone.0266800
 @article{ellermann2022,
  title = {Identifying content to improve risk assessment communications within the Risk Profile: Literature reviews and focus groups with expert and non-expert stakeholders},
  author = {Ellermann, Christin and McDowell, Michelle and Schirren, Clara O and Lindemann, Anna-Katrin and Koch, Severine and Lohmann, Mark and Jenny, Mirjam A},
  date = {2022},
  journaltitle = {PLOS ONE},
  volume = {17},
  pages = {e0266800},
  doi = {10.1371/journal.pone.0266800},
  number = {4}
}
Under review
Schirren, C. O., Jenny, M. A., Ellermann, C., Lindemann, A.-K., Koch, S., Lohmann, M., & . (under review). Communicating risk assessments results: A randomised trial of risk profiles.
